GIFT Operator Station Instructions
- GIFT Operator Station Instructions
Overview
This document instructs how to use the GIFT Monitor Module and the GIFT Control Panel Tool.
The various functions of the Monitor are presented to the user on dedicated panels, each of which is accessed by clicking on the corresponding tab. See Figure 1 below.
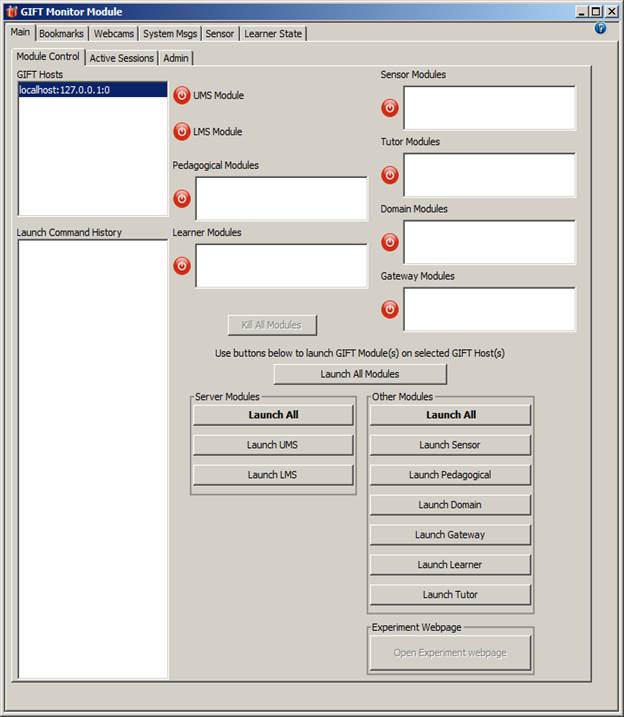
Figure 1: Module Monitor with Main Panel selected. Note that your image may look a little different depending on your Window’s and Java window preferences.
Instructions describing the configuration of the Monitor Module can be found in the GIFT Configuration Settings document.
The Control Panel Tool allows the user to launch various GIFT applications. Tools are presented to the user on dedicated panels accessed by their corresponding tabs.
The functions of the Monitor Module and Control Panel Tool are described in detail below.
Monitor Module
Main Panel
The Main Panel provides access to the following functions:
- Monitor GIFT hosts
- A GIFT Host is a computing platform (hardware & OS) set up and running (or available to run) one or more GIFT Modules. GIFT Hosts other than the local host running the Monitor must be running the RemoteLaunchService (see Appendix A) to be monitored.
- Launch GIFT modules
- Monitor running GIFT modules
- Terminate or Stop (aka Kill) GIFT modules
- Open the Tutor Web Page in the default browser
- Display of key information concerning the GIFT instance
- Monitor active GIFT users and active Domain Sessions
To access the Main Panel, click on the “Main” tab with the mouse. The functions of the main panel are segregated into sub-panels, each of which is accessed by clicking on its corresponding tab. The sub-tabs/panels are discussed below.
Module Control Sub-Panel
The Module Control sub-panel is accessed by clicking on the “Module Control” sub-tab. This sub-panel provides access to the following functions:
- Monitor GIFT hosts
- Launch GIFT modules
- Monitor running GIFT modules
- Terminate or stop (aka Kill) GIFT modules
- Open the Tutor Webpage in Internet Explorer, in Experiment Mode.
To access these functions, first click on the “Module Status” sub-panel.
Monitor GIFT Hosts
The upper left portion of the Module Control sub-panel is a list box labeled “GIFT Hosts”, which contains a list of available GIFT hosts on which GIFT modules may be launched. The list will always contain an entry for “localhost:127.0.0.1,” which refers to the local host. In addition, the list will contain an entry for each host that is running a properly configured instance of the GIFT RemoteLaunchService (see Appendix A for more detail on the RemoteLaunchService).
In addition to viewing the available GIFT Hosts, the list box is used to select one or more GIFT Hosts on which to start GIFT modules. To select a single host, simply click the corresponding entry in the list. To select multiple GIFT hosts, hold the CTRL button down while clicking on the desired GIFT hosts.
Launching GIFT Modules
GIFT Modules are launched by clicking on the launch buttons located at bottom-center and bottom-right portions of the panel. For convenience the buttons to launch individual modules are grouped into “Server modules” and “Other (non-server) modules”. For each grouping, a “Launch All” button is provided to conveniently launch all modules in the group. Finally, a global “Launch All Modules” button is available to quickly start all modules in a single button click.
Server Modules
| Button Label | GIFT Module Launched |
| Launch All | All Server Modules (i.e., all modules listed below in this table) |
| Launch UMS | User Management System Module |
| Launch LMS | Learning Management System Module |
Table 1: Buttons Used to launch GIFT Server Modules
Other (Non-Server) Modules
| Button Label | GIFT Module Launched |
| Launch All | All “Other” Modules (i.e., all modules listed below in this table) |
| Launch Sensor | Sensor Module |
| Launch Pedagogical | Pedagogical Module |
| Launch Domain | Domain Module |
| Launch Gateway | Gateway Module |
| Launch Learner | Learner Module |
| Launch Tutor | Tutor Web Server Module |
Table 2: Buttons Used to launch Other (non-Server) GIFT Modules
To launch GIFT modules, first select one or more GIFT hosts using the GIFT Hosts list box, previously described. Then use the mouse to click on the buttons corresponding to the GIFT module(s) you want started on the selected GIFT Host(s).
For the UMS and LMS modules, only a single instance of each should be running on a GIFT network, so they should not be started on multiple hosts. If multiple hosts are selected or if either of them is already running, the corresponding launch button(s) will be disabled.
When the buttons for the remaining module types are clicked, a GIFT module instance of that type will be started on each of the previously selected GIFT hosts. For example, if three GIFT hosts are selected, and then the “Launch All” (Other Modules) button is clicked, then all three of the modules (Sensor, Domain, Gateway) will be started on each of the three GIFT hosts -- a total of nine processes started across three hosts.
As launch commands are issued, a running history of the launch commands is kept in the “Command History” list box appearing at the bottom-left of the sub-panel. This is for informational purposes only.
Near the bottom
Monitoring GIFT Modules
The top-center and top-right portion of the Module Status sub-panel is dedicated to monitoring the running GIFT Modules. A labeled indicator light (which also acts as a button) is displayed for each module type (UMS Module, LMS Module, Pedagogical Module, etc.). This indicator/button will be colored red if no modules of the respective type are currently running, and it will be colored green if at least one instance of the module type is running. For six of the eight module types, the indicator light/button is accompanied by a small list box positioned just to the right of the indicator. For these module types, as new module instances appear on the GIFT network, an additional row will be added to the list box. Similarly, as those modules are stopped, the corresponding entry will be dropped from the list box. If/when all modules of a particular type have been removed from service, then the indicator light will return to red color. The remaining two module types (LMS and UMS) have no such list box because GIFT currently does not support multiple instances of these modules running on a single GIFT network. In these two cases, if the indicator appears green then a module of the corresponding type is running. If the indicator appears red then a module of that type is not running.
Note that a few seconds may elapse before the indicator lights react to starting or stopping of GIFT modules. Figure 2, below, shows the Module Status sub-panel.
GIFT modules are only visible to (monitored by) the Monitor if they are configured to run on the same ActiveMQ instance as the Monitor.
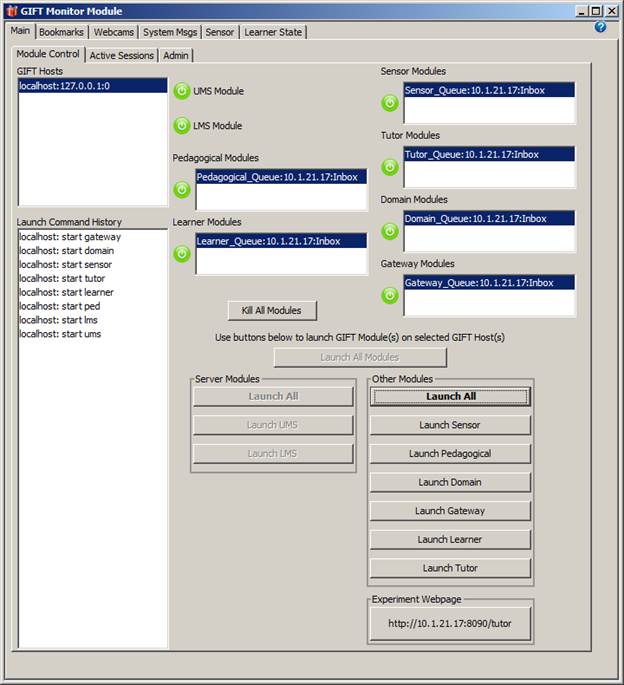
Figure 2: Monitor Module Showing Green Module Status Indicators on the Module Status sub-panel. Note that your image may look a little different depending on your Window’s and Java window preferences.
Killing (aka terminating or stopping) GIFT Modules
GIFT Modules may be killed (i.e., stopped or terminated) individually by clicking once on the green indicator status light/button next to the module type. For module types where the status indicator light is accompanied by a list box, the user must first select the GIFT module instance in the list box, and then click the green status light. After clicking, allow several seconds for the module termination to be reflected in the status view (i.e., for the list box entry to disappear and/or the status light to change to red color).
Individual modules may also be terminated by closing the associated console window, or by selecting the console window with the mouse (giving it focus) and then pressing any key on the keyboard.
To kill all currently active GIFT modules on the GIFT network, click once on the “Kill All Modules” button near the center of the sub-panel. After clicking the “Kill All Modules” button, the user will be presented with a confirmation dialogue. To continue with the operation, confirm it by clicking “yes”, otherwise click “no” to cancel the operation. Killing individual modules by clicking on the indicator light/button does not require confirmation.
As mentioned in the previous section, GIFT modules are only visible to (monitored by) the Monitor if they are configured to run on the same ActiveMQ instance as the Monitor. In the same way, only GIFT modules running on the same ActiveMQ instance can be terminated via the Monitor.
Open the Tutor Web Page in the default browser
To open the Tutor Webpage in the default browser, click the “Open Tutor Webpage” button, located in the lower right corner of the sub-panel. Note that this button will not be active until shortly after the tutor web server has been launched.
Active Sessions Sub-Panel
The Active Sessions sub-panel is accessed by clicking on the “Active Sessions” sub-tab. The Active Session sub-panel supports the following functions:
- User and Session ID display
- Initiate monitoring of a domain session
- Force a domain session to end
User and Session ID display
As users log into GIFT and begin domain sessions, their respective user ID and domain session IDs will appear in the corresponding list boxes in the Active Sessions Sub-Panel. See Figure 4 below.
Initiate monitoring of a domain session
To begin monitoring a domain session, first select a domain session ID in the Active Domain Session List Box. Then click the button labeled “Monitor Domain Session.” Monitoring a domain session will result in the following behaviors:
· The Sensor Panel will become active with the sensors involved in the domain session.
· A Domain Session Messages Panel will be created and become accessible through the list of tabs at the top of the Module Monitor.
· The Learner State Panel will become activated. Note however, that the Learner State Panel may not populate with data until some activity takes place within the training application.
Use of the Sensor Panel, Domain Session Panel and Learner State Panel are described elsewhere in this document.
Force a Domain Session to end
Select a domain session ID in the Active Domain Session List Box. Click the “End Session" button.
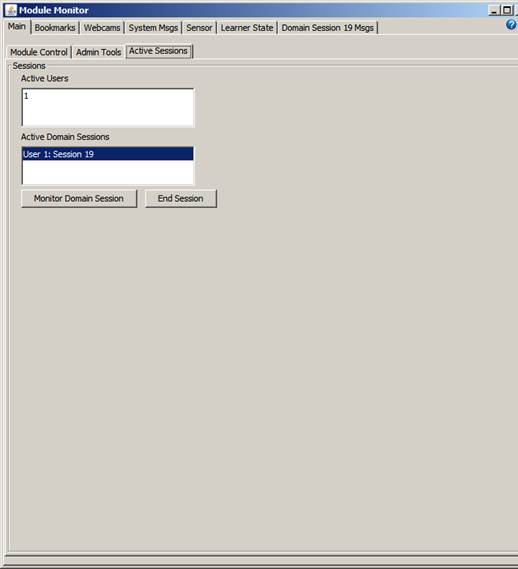
Figure 4: Active Session Sub-Panel showing an Active User and Domain Session
Bookmarks Panel
The Bookmarks Panel provides a way for the instructor/experimenter to create, edit and delete timestamped textual annotations (aka “bookmarks”) during the course of a domain session, and have them automatically logged to a text file on a per-domain-session basis. Later, the file contents can be merged with data from other GIFT logs from the same domain session for post-experiment analysis using the Event Reporting Tool (ERT). The Bookmarks Panel is accessed by clicking on the “Bookmarks” tab with the mouse as shown in Figure 5 below.
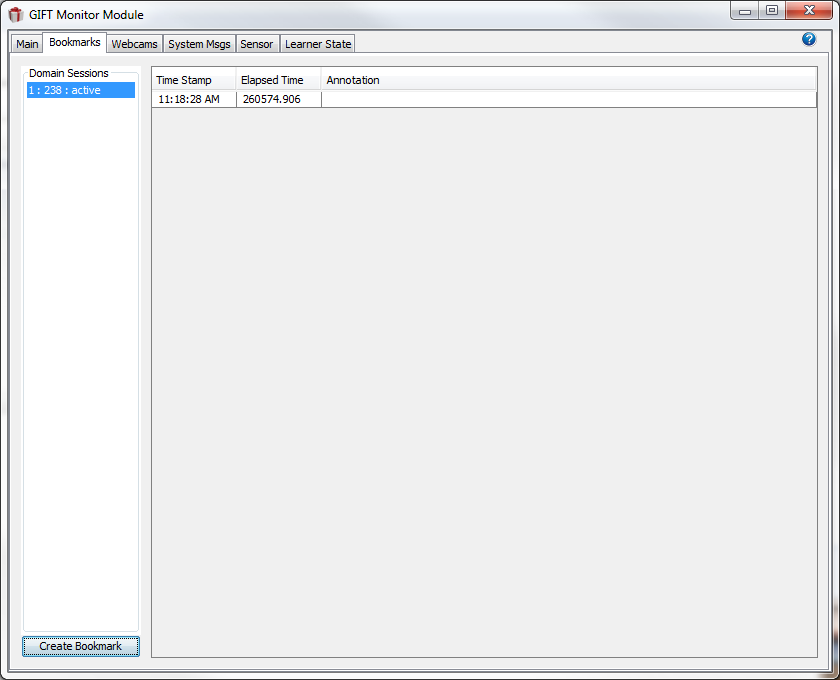
Figure 5: Module Monitor Bookmarks Tab
The panel is divided into two main areas. Along the left edge of the panel is a list box labeled “Domain Sessions” which lists all the current and recently active domain sessions. Immediately to the right, and occupying most of the remainder of the panel is the bookmark display table. This is where individual bookmarks appear for review and for editing, with one row for each bookmark. The table has two columns, one for the timestamp and the other for the bookmark annotation. The time stamp is filled in automatically so only the annotation is editable.
The first step in performing any bookmarking operations is to select the desired domain session entry in the Domain Session list box. Doing so loads the bookmark display table with the bookmarks for the selected domain session.
The format of the entries in this domain session list box is:
< userId >:< domain session id >:< status [ active | complete ] >
If a domain session is active, the status will be “active.” If the domain session has recently completed, the entry in the list box will persist for a period of time and the status will be “complete.” The persistence allows the instructor to perform bookmark operations for a domain session for a short period of time after it concludes.
Regardless of the domain session status, if a domain session entry appears in the Domain Session list box, bookmarks for that session can be created, edited, and deleted. However, once the domain session entry disappears from the list, bookmark operations for that domain session are no longer possible using this tool. Further editing may still be performed, but must be done manually (i.e., without the benefit of the tool) by locating the file and opening it with a standard text editor.
Create Bookmark
After selecting the desired domain session, click the “Create Bookmark” button located directly below the Domain Sessions List box. This will create a new timestamped bookmark with an empty annotation which will appear as a new row in the bookmark display table. (The time-stamp is recorded the instant you press the Create Bookmark button, rather than when its creation is finished). You may begin entering the annotation immediately by typing with the keyboard. To save the annotation, you must do one of the following:
- Press the Enter key
- Press the Tab key
- Use the mouse to click on another row of the bookmark table
Edit an Existing Bookmark
With the desired domain session selected, use the mouse to click or double-click on the bookmark annotation to be edited. At this point, the annotation text is editable and you can begin using the keyboard to edit the annotation as desired. When editing is complete, save the edit by pressing the “Enter” key, the “Tab” key, or by clicking elsewhere in the bookmark table with the mouse. To undo an edit prior to saving it, press the “ESC” key. The annotation will return to the state it had prior to the start of the edit operation. (NOTE: The use of tabs or line breaks within annotations is not supported.)
Alternatively, to edit an existing bookmark, first single click the bookmark, then follow immediately with a right-click anywhere within the bookmark display table. The right click will bring up a small popup menu. Within the popup menu, click on “Edit”. Doing so will present the existing bookmark annotation in an editable and scrollable text area contained within a popup dialog. This method of editing will allow for easier editing of lengthy annotations. To save annotations made in this way, click the “OK” button on the popup dialog or simply press the “Enter” key. To cancel the current edits and restore the annotation to its previous state simply click the “Cancel” or “ESC” button.
Delete a Bookmark
To delete an existing bookmark, first use the mouse to select the appropriate domain session from the Domain Session list and load the bookmarks for that domain session into the bookmark list display table. Use a single mouse click to select the bookmark to delete. At this point you can either press the “Delete” key, or access the delete function by right-clicking on the bookmark list display table and then selecting delete. Either way, you will be presented with a confirmation dialog. When the dialog appears, click “OK” (or press “Enter”) to proceed with the deletion or click Cancel (or press “ESC” key) to cancel the deletion.
Webcams Panel
The intent of the webcams panel is to allow an experimenter/operator to observe a live video stream of one or more GIFT users during GIFT sessions.
Each GIFT user station requiring observation must be equipped with a webcam and must be configured according to the instructions provided in the GIFT Install Instructions. Additionally, the monitor should be configured to view each of the webcams, as described in GIFT Configuration Settings.
Viewing a Single Webcam
The left side of the webcams panel contains a list of webcams available for viewing. The names presented in the list correspond to the names used in the cameras.txt configuration file (described in GIFT Configuration Settings.). To view a particular webcam simply click on the name of the desired webcam with the mouse. The view the video stream originating from that webcam will immediately be seen in the viewing panel which comprises the majority of the webcams panel. See Figure 6 below.
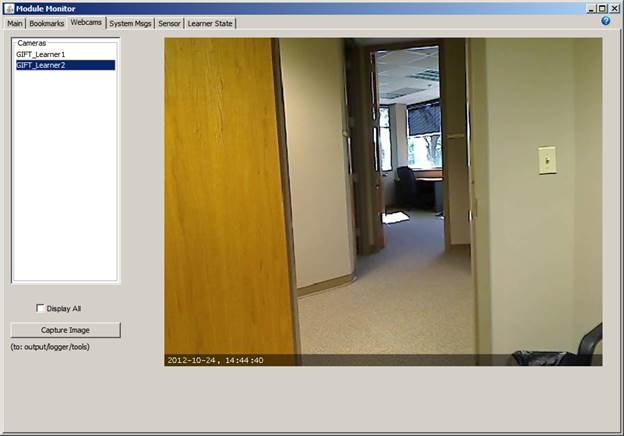
Figure 6: Webcams Panel showing the view from a single web cam.
Viewing All Webcams
If multiple webcams are configured, then the streams of all available webcams can be viewed simply by selecting the check box labeled “Display All”, which appears just below the list of webcams. After doing so, the display area will show a tiled view of all webcams currently configured for operation within the GIFT environment. To revert to single webcam view, simply uncheck the “Display All” checkbox. See Figure 7 below.
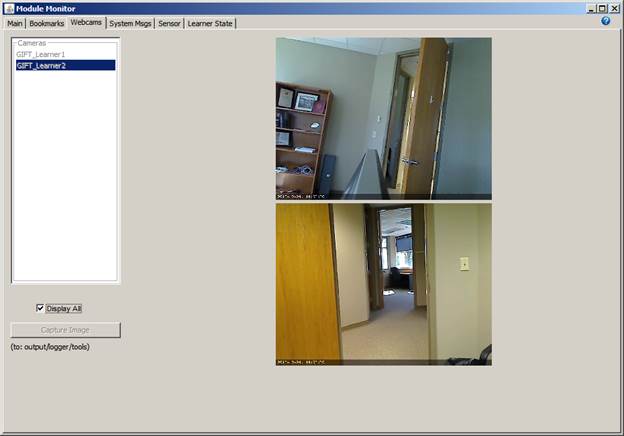
Figure 7: Webcams Panel displaying all webcams.
Capturing a Webcam Image
While viewing a single webcam, it’s possible to save a camera screenshot to an image file by clicking the “Capture Image” button. The camera image in view at the time of the button press will be saved to an image file in the output/logger/tools folder in PNG format. The file name will be a concatenation of the webcam name and the local date and time when the button was clicked.
The following capabilities are not currently supported:
- Video recording (via the Monitor webcam, rather than a Sensor Module)
- Automated (timed) image captures
- Viewing of some intermediate number of webcams (currently it’s one at the time or all).
Message View Panels
Overview
The monitor provides two types of Message View Panels, each of which allows real-time view of the GIFT messages being exchanged between the various GIFT modules. These are:
- System Message Panel
- Domain Session Message Panel
The layout and operation of the two panel types are nearly identical and will be described following a brief description of the differences below.
Differences between the Panel Types: Messages Displayed
The System Messages Panel is designed to provide a real-time view of the system-level messages exchanged between GIFT modules for the purpose of initializing and maintaining the GIFT system including: module discovery, user login, user domain selection and all other actions leading up to the start of a domain session. In contrast, the Domain Session Message Panel is concerned strictly with messages exchanged in support of a specific domain session.
Differences between the Panel Types: Correspondence to Log Files
Not coincidentally, these two type of message view panels correspond directly to the message log files recorded by the system in the GIFT/output/logger/message folder. Messages shown in the System Message Panel correspond to messages found in the log files with names starting with “system.” Messages shown in the Domain Session Message Panel correspond to those recorded in the log files starting with “domainSession.”
Differences between the Panel Types: When and How the Panels are Displayed
System level messages are continually being exchanged any time GIFT modules are running, and these messages are essentially global with respect to the GIFT instance. Accordingly, there is only one System Message Panel and it is always available. To access the System Message Panel, click on the tab labeled “System Msgs”.
In contrast, each Domain Session Message Panel corresponds to a specific domain session. These panels are not launched automatically; rather they are started by the user using the Active Sessions sub-panel of the Main Panel. (See the corresponding section of this document for details.) Once launched, these panels are accessed by clicking on the corresponding tab. Domain Session Message Panel(s) must also be explicitly closed by the user by clicking on the “Close” button located at the top-center of the panel (Refer to diagrams below).
Common Layout and Function of the Message Panels
For the remainder of the discussion, the System Message Panel and Domain Session Message Panels will simply be referred to as Message Panels.
Each Message Panel consists of two sub-panels:
- Message Flow sub-panel
- Statistics sub-panel
The Message Flow sub-panel contains the key functionality of the Message Panel and is illustrated in Figure 8 below.

Figure 8: (Domain Session) Message View Panel (showing Message Flow Sub Panel)
The User interface of the Message Flow Sub Panel contains several functional areas:
- Control Panel (Top)
- Message List Panel (Left)
- Message Animation Panel (Center)
- Message Filter Panel (Right)
- Message Detail Panel (Bottom)
Message Flow / Control Panel
Currently, the primary function of the Control Panel is to enable or disable the listening capability of the Message Panel as a whole. This control is exercised via the checkbox labeled “Listen”. With the “Listen” checkbox checked, the panel is actively listening for GIFT messages and the various sub-panels will be automatically updated in real time. Conversely, when the checkbox is unchecked, the panel as a whole will stop listening for messages and will not update in real time.
Disabling listening allows the user to peruse the recently captured messages without risk of interruption caused by receipt of additional incoming messages. This is especially important considering that the Message Panel makes use of a limited size buffer to hold incoming messages and that after a time, new messages may push the messages of interest out of the buffer. The message buffer size is set via the monitor properties file. Details can be found in the GIFTConfigurationSettings.docx document.
It’s important to note that while listening is disabled, a Message Panel will disregard all incoming messages so the messages will not be visible in the monitor. They will, however, be present in the corresponding log files. To resume listening on future messages, simply recheck the listen checkbox. New messages will then being accessible via the panel.
For Domain Session Message panels (only), the Control Panel also contains a “Close” button, which closes the panel when clicked.
Message Flow / Message List Panel
The Message List Panel displays a scrollable list of messages that have been captured by the Message View Panel. Which messages appear in the list is controlled first by the type of the Message Panel (i.e., System or Domain Session), and secondly by the Message Filter (see Message Filter discussion below).
Each row in the list corresponds to a single message and the row text is simply a textual description of the message type. Messages are presented in the order they have been received with the oldest messages at the top of the list and the newest messages at the bottom.
Individual messages within the list may be selected using the mouse. When a message is selected, the details of that message will be shown in the Message Detail area at the bottom of the Message Panel. If the Message Panel is in non-listening mode, then a pair of arrows reflecting the source and destination of the message will be shown (for details see the Message Animation Area section below).
Message Flow / Message Filter Panel
The message Filter panel is located on the right side of the Message Panel. As new message types are encountered by the Message Panel at runtime, those types are added to the filter list. Each message type in the list has an associated checkbox. If the checkbox is checked, then messages of the associated type will appear in the Message List Panel and Message Animation Panel. Message of types that are unchecked in the filter will not appear in those panels.
A single message type can be checked by clicking the corresponding checkbox with the mouse. To select multiple message types, hold the CTRL key down while clicking. One may also select a range of message types by first clicking a single message type, then holding the SHIFT key down while selecting another message type. Finally, all the message types may be selected by pressing the ‘A’ key down while holding the CTRL key down.
Message Flow / Message Animation Panel
The message animation panel -- located in the center of the Message Panel -- displays a graphical representation of the flow of messages within the GIFT system. Along the bottom of the panel canvas (drawing area) is a horizontally oriented rectangle representing the GIFT message bus (currently ActiveMQ). Staggered across the top of the canvas are multiple smaller rectangles, each of which represents a messaging endpoint (message source or destination). The endpoints are labeled according to their associated module and/or purpose.
When the Message Panel is in Listening mode (i.e. listening is enabled), messages that are received by the Panel and added to the Message List View (subject to the Filter Panel settings), are transiently depicted in the Message Animation Panel as a pair of arrows. The first arrow represents the message traveling from the source endpoint to the message bus; the second represents the message traveling from the message bus to the destination endpoint. Drawn next to each arrow graphic is a textual representation of the message’s sequence number. Each message animation graphic persists for 100 milliseconds.
When Listening is disabled, the message animation arrows do not appear automatically, but rather are displayed in reaction to the user’s selection of individual messages in the Message List Panel. In this mode, the arrows for a particular message persist until another message is selected (or until Listening mode is again enabled). Using this feature, a user can step through a sequence of messages and observe the message flow through the system.
Message Flow / Message Detail Panel
The Message Detail Panel is at the bottom of the Message Panel. It’s one and only purpose is to display messages, selected by the user in the Message List Panel, in human a readable format. If the formatted display of the message requires more space than the height of the display area, a vertical scroll bar will appear to allow access to the entire message. If detailed analysis of a message is required, the message details can be copied and pasted into another application.
Statistics Panel
The Statistics sub panel of each Message View Panel is accessed by clicking on the “Statistics” tab. The panel consists of a table with four columns, as shown below in Figure 9. Each row in the table corresponds to a message type that has been observed by the Message Panel since the start of the current session. The first column contains the name of the message type. The second column contains a count of the messages of a particular type that have been received since the message panel has been activated. Columns three and four are labeled “Total Size” and “Average Size” but cells in these columns are not currently being populated.
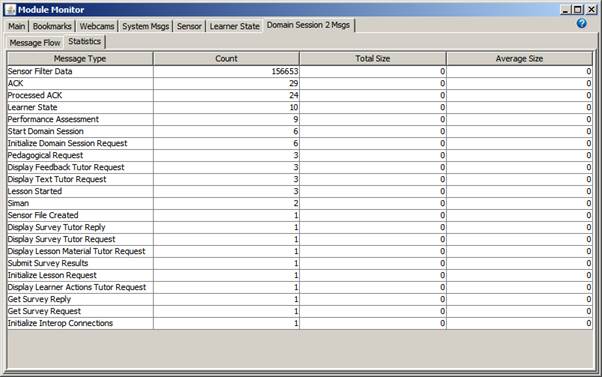
Figure 9: (Domain Session) Message View Panel showing Statistics Sub-Panel
Sensor Panel
The Sensor Panel allows real-time monitoring of the output from Learner Station sensors. To access the Sensor Panel click on the “Sensor” tab of the monitor module.
Real-Time Monitoring of Sensor Data
Real-time monitoring of sensor output is available only within the context of a Domain Session.
With a domain session underway, use the Active Sessions sub-panel of the Monitor Main Panel to begin monitoring the desired domain session (see the Main Panel discussion elsewhere in this document for details). Now activate the sensor panel by clicking on the “Sensor” tab. Figure 10, below, depicts the monitor module with the sensor panel active.
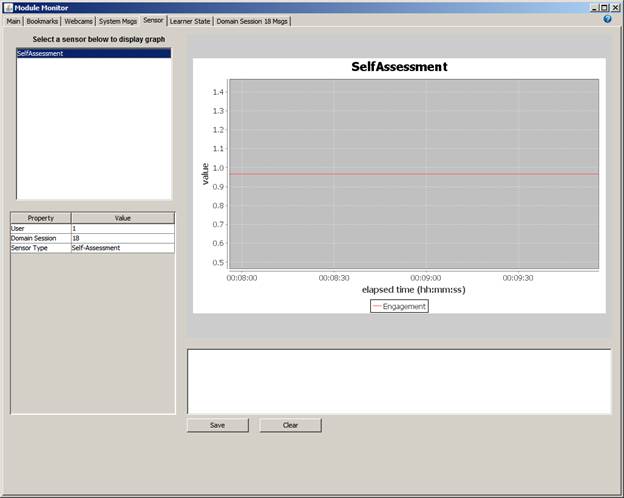
Figure 10: Sensor Panel
The upper left portion of the sensor panel is a list box containing a list of sensors that are currently available for real-time monitoring. Clicking on a sensor will cause the main graph area to begin displaying a real-time plot of the sensor’s data stream in the graph view portion of the panel. Properties of the selected sensor and domain session will also appear in the properties display just below the sensor list. The bottom of the panel is a text area dedicated to textual output of all errors and informational messages reported by all sensor modules since the monitor was launched. Messages appearing in the text area can be saved to a file using the save button. The text can also be cleared using the clear button.
The monitor supports just a single Sensor Panel, which supports real-time monitoring of the data stream from a single sensor within a specific domain session. If a domain session is running multiple sensors, each of the active sensors will appear in the sensor list, but only the user-selected sensor will be displayed in the real-time graphical view. The view can be switched to another sensor in the list, simply by clicking on it. The graphical view will support overlay of traces coming from multi-channel sensors, provided the sensor messages are properly encoded (Details are outside the scope of this document. Refer to the source code for more information.)
Learner State Panel
The Learner State Panel displays the currently known state of a learner and is accessed by clicking on the “Learner State” tab as shown in Figure 11. As with the Sensor Panel, the Learner State Panel is only actively populated with data after a Domain Session monitoring has been initiated via the Active Sessions sub-panel of the Main Panel (refer to the relevant section of this document for details.)
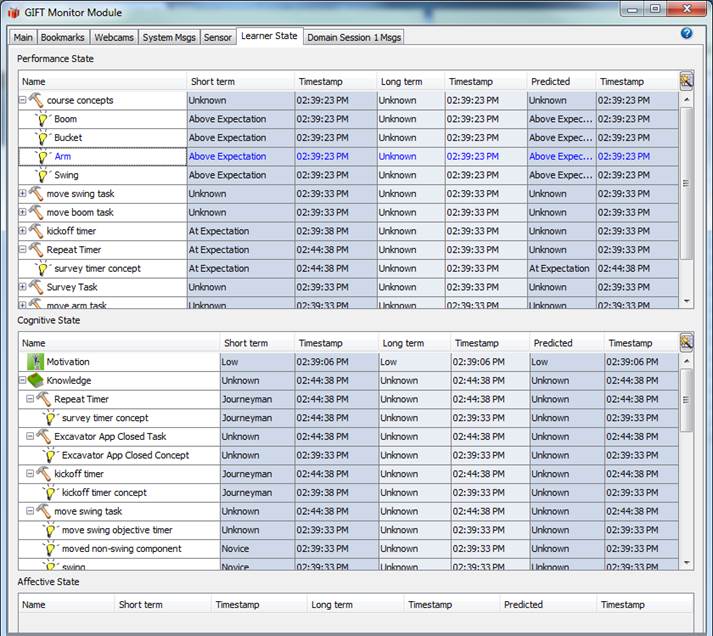
Figure 11: screenshot of the Learner State Panel populated with an example learner state.
Currently, the display on the Learner Panel is limited to a table for each category of learner state: Performance, Cognitive and Affective. Therese are columns for each temporal value of short term, long term and predicted state for that attribute along with the timestamp at which that particular value was set.
Control Panel
The control panel provides an interface to launch many of the GIFT applications and tools. It is a separate application from the Monitor and it replaces the functionality that was once on the Monitor’s “Admin Tools” tab.
Operator Tools Panel
The Operator Tools panel is accessed by clicking on the “Operator Tools” tab.
The following tools can be launched directly by clicking on the corresponding buttons located on the panel:
- Monitor Module
- Please launch ActiveMQ before launching the Monitor Module
- ActiveMQ
- Import Tool
- Export Tool
- Event Report Tool
- To open the Event Report Tool (ERT) in the default web browser, click the “Event Report Tool” button.
- Refer to GIFT Event Report Tool for instructions on use of the ERT.
Authoring Tools Panel
Authoring tools can be accessed by clicking the “Authoring Tools” tab.
The following authoring tools can be launched directly by clicking on the corresponding buttons located on the panel:
- AutoTutor Authoring Tool
- Course Authoring Tool
- Domain Knowledge File (DKF) Authoring Tool
- Gift Authoring Tool (GAT)
- To open the GIFT Authoring Tool (GAT) in the default web browser, click the “Gift Authoring Tool” button.
- Learner Configuration Authoring Tool
- Metadata Authoring Tool
- Sensor Configuration Authoring Tool
- Pedagogy Configuration Authoring Tool
- Sensor Configuration Authoring Tool
- SIMILE Workbench
- Survey Authoring System (SAS)
- To open the Survey Authoring System (SAS) user interface in the default web browser, click the “Survey Authoring System” button.
- Refer to GIFT Survey Authoring System Instructions for instructions on use of the SAS.
Documentation for these tools can be accessed via the help menu within the respective applications.
Appendix A – Remote Launch Service
The Remote Launch Service (RLS) is a Java application included with the GIFT distribution which supports launching of GIFT modules from the Module Control Sub-Panel, as described earlier in this document.
Its primary functions are:
- Discover the Monitor Module by listening for broadcasts being sent by the Monitor Module
- Announce its ongoing presence back to the Monitor Module by sending heartbeats to it
- Listen for launch command messages coming from the Monitor Module
- Launch Modules in accordance with incoming messages from the Monitor Module
The RLS should be launched on workstations intended to run GIFT modules that will be started remotely.
Launching the Remote Launch Service
To launch the Remote Launch Service, double click on the launchRemoteLaunchService.bat script, located in the GIFT/scripts/tools folder. Alternatively, it can be launched from the command line.
For many users, the default configuration of the RLS and the Monitor Module will suffice. In some cases, custom configurations may be required. Refer to the appropriate sections of the GIFT Configuration Settingss for instructions on configuration. Restart the RLS after making changes to the configuration file.
The Remote Launch Capability is intended for use on a local area network. Other configurations, such as launching Modules on remote hosts behind a router, should be possible with the right configuration settings and using port forwarding on the router, but such configurations are beyond the scope of this document.